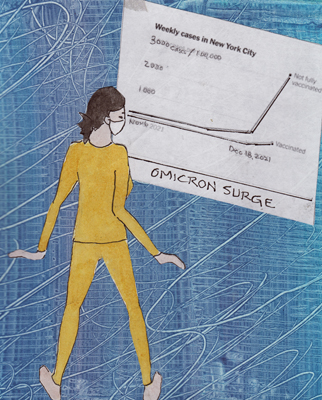
Infection Numbers in Fully Vaccinated vs Unvaccinated
Yesterday the New York Times had graphs for Covid-19 infections in New York City and Seattle, both cities had timely data for the rates of infection. In NYC the graph shows the number of weekly cases per 100,000 from Nov 6th to Dec. 18th. Infections in NYC by 12/25 were more than 85% omicron variant. The Y axis on the graph is 0-3000 cases per 100,000 people. Vaccination doesn't prevent "infection", but does block severe disease. and this is also seen in hospitalizations and deaths in the graphs published in the NYT article for each.. The graphs for Seattle are also very similar - telling a consistent story.
The other two graphs for NYC also demonstrate a stark difference between the unvaccinated and fully vaccinated less than 1 month ago.
HOSPITALIZATIONS: Not fully vaccinated - 80 weekly per 100,000 people. Less than 10 weekly per 100,000 people in the fully vaccinated. Statistics from other studies show that many of these people (as many as 40%) are hospitalized with other diagnoses, but were positive for Covid-19 when tested.
DEATHS: Not fully vaccinated - 4 weekly per 100,000 people. Less than 1 in the fully vaccinated and the graphs show the big difference. Deaths tend to lag 2-3 weeks after being infected, so the differences are expected to continue to rise.


